Al, 2020
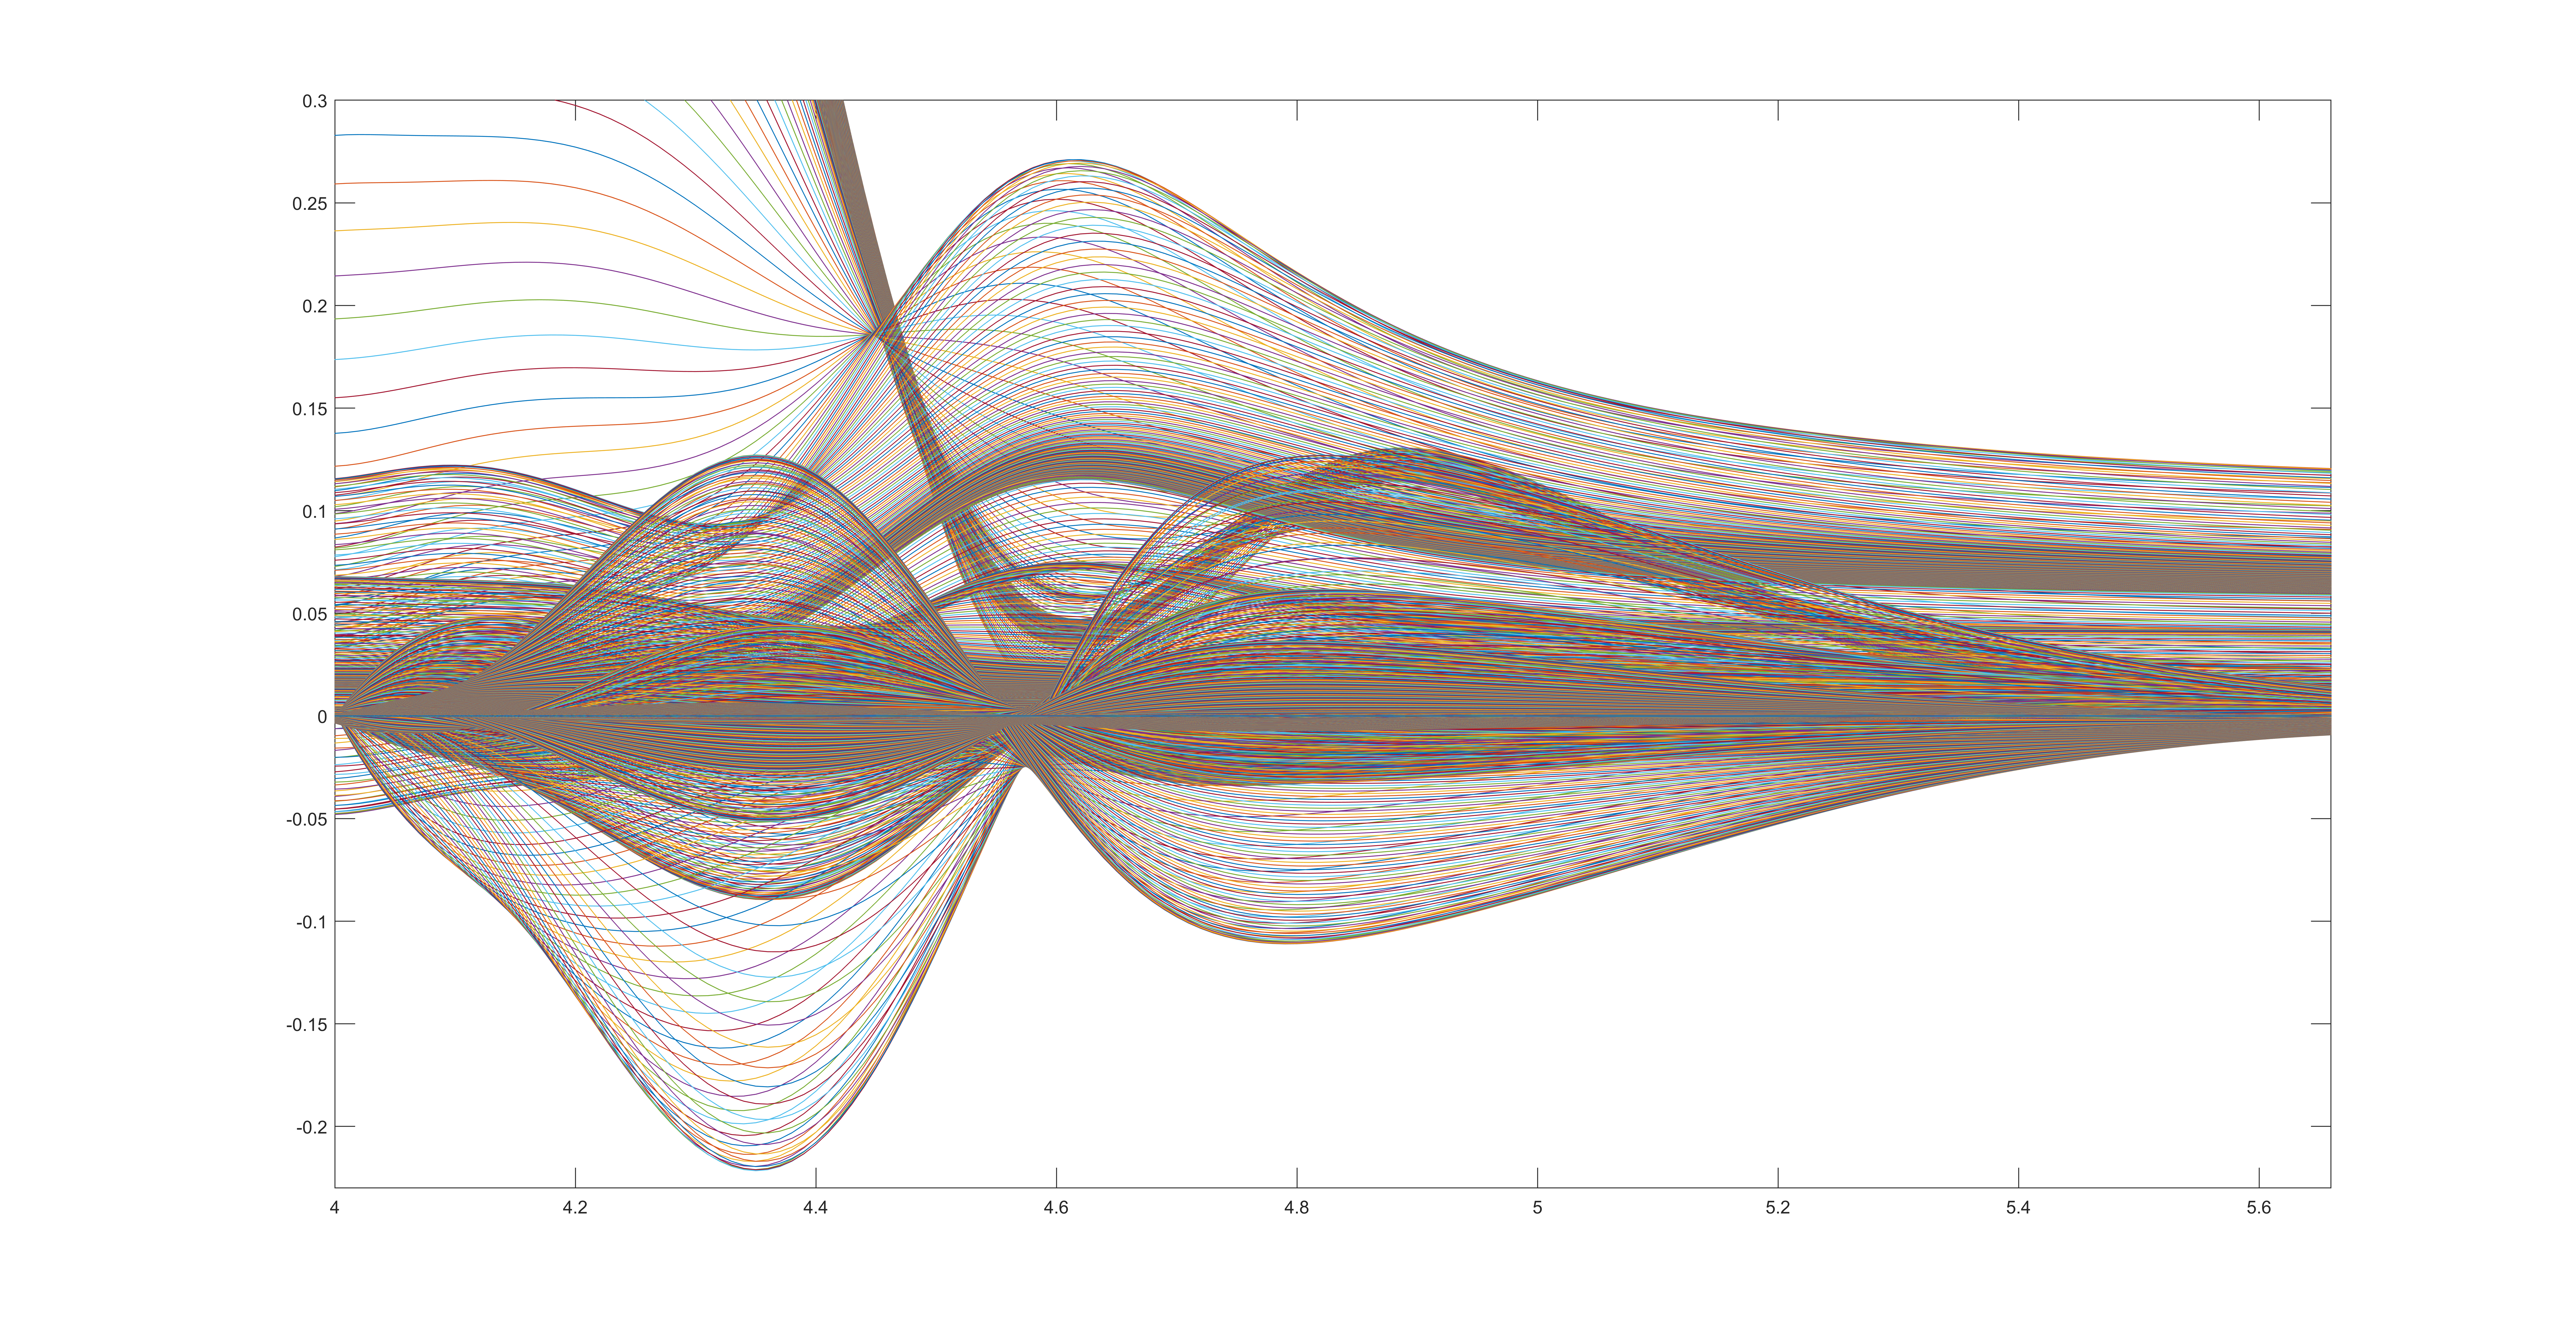
In an assignment to simulate a control system in MATLAB, I needed to plot its Lyapunov function v(t), which is a strictly decreasing function consisting of sums of errors in the control system. The function is calculated in part by multiplying the 4x1 error vector e(t) and 4x4 matrix P together as e(t)’Pe(t) (apostrophe is the transpose), which produces a scalar. In addition to some other problems, instead of assigning e(t) to the error vector at time t, I assigned error at every timestep to e, resulting in a 4x4000 matrix. As a result, plotting v(t) shows 4000 different signals that result from mixing error values from different timesteps. Since e at consecutive timesteps are relatively evenly spaced, the curves plotted are also evenly spaced aesthetically in a way that reminds me of glassblowing or squids swimming mid-stroke.

